


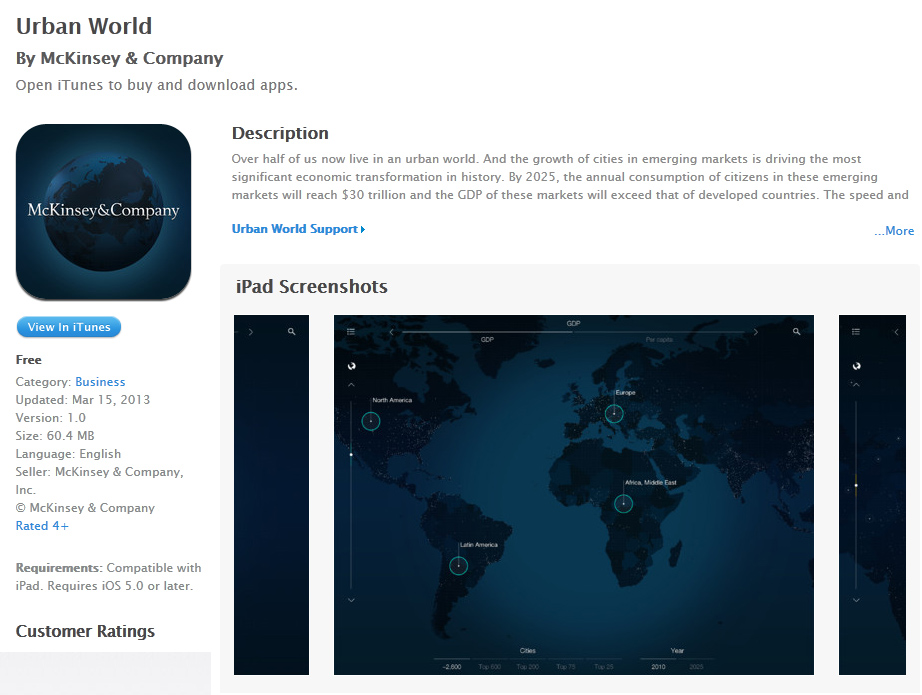
Visualizing the future urban world — from fastcoexist.com by Ariel Schwartz
A new app called Urban World beautifully projects how cities around the world are going to explode in growth and economic power by 2025.
Also see:
Visualizing the future urban world — from fastcoexist.com by Ariel Schwartz
A new app called Urban World beautifully projects how cities around the world are going to explode in growth and economic power by 2025.
Also see:
13-foot 12,000-pound mechanized robot suit now for sale in Japan — from venturebeat.com by John Koetsier
Also see:
and:

From DSC:
These items cause me to reflect yet again on the state of our hearts...as it doesn’t take much to think of the next steps in terms of using such robots as instruments of war. Do you think I’m stretching a bit too far here? How about after considering the following interactive visualization that Google just created?
.

Addendums:

.
Addendums/also see:
Envisioning the future of education — from envisioningtech.com by Michell Zappa
Excerpt:
Models of teaching worldwide are being revolutionized and reconsidered in real-time, and it seems everybody is looking for the holy grail of how to future-proof their classrooms. Advancing technology is leaving old schools of thought in their wake, and teachers are waking up to the fact that things will only speed up further in the foreseeable future.
Having spent time with the wonderful people at TFE Research in Dublin earlier this year, our new visualization is a concise overview of technologies that have the potential to disrupt and improve teaching on all levels.
Along with a few dozen emerging techs, we identified six key trends that link and contextualize said technologies, including classroom digitization, gamification and disintermediation.
.

In Silicon Valley, designers emerge as rock stars — from Reuters.com by Gerry Shih
Excerpt:
The new breed of “user experience” designers – part sketch artist, part programmer, with a dash of behavioral scientist thrown in – are some of the most sought-after employees in technology. Entry-level interactive designers at startups are commanding salaries easily topping $80,000, almost twice the median pay for primarily print designers of about $45,000, according to a recent survey by the American Institute of Graphic Arts.
From DSC:
From my experience with Internet-related work and careers, most people are either gifted in the front end of things (interface design, graphic design, web design, etc.) or in the back end of things (programming, databases, scripting, e-commerce, security, etc.). I have seen individuals who can do both…but it’s rare that someone is deeply versed in both sides of the coin.
What are we doing in higher ed to foster more cross-disciplinary skills/assignments/projects/teams like this?
Simulation beyond perspective — from noemalab.eu by Pier Luigi Capucci
The discourse of holography as a tool for imagery, art, media studies and science.
Excerpt:
Holography suggests a new visual universe within a culture where the visual simulation is the most effective communication system; and it let us reflect about the need for a more comprehensive definition of “image”. We can believe that future images will also be holographic and that we shall communicate more and more through them, in a delicate balance between presence and absence, immediacy and remoteness, present and past, materiality and immateriality, matter and energy.
Infographic of the day: What are the darkest parts of the Bible? — from fastcodesign.com by Suzanne LaBarre; also Openbible.info
Openbible.info charts the Bible according to positive and negative sentiment–with some surprising results.

Excerpt:
What you end up with is a snapshot of the relative cheeriness–or gloom–of different sections in the Bible. As the designer tells it:
Things start off well with creation, turn negative with Job and the patriarchs, improve again with Moses, dip with the period of the judges, recover with David, and have a mixed record (especially negative when Samaria is around) during the monarchy. The exilic period isn’t as negative as you might expect, nor the return period as positive. In the New Testament, things start off fine with Jesus, then quickly turn negative as opposition to his message grows. The story of the early church, especially in the epistles, is largely positive.
In short, it gives you a bird’s-eye view of the tone of each book, something that’s easy to miss in a line-by-line reading. You could also use it as a guide of sorts to the darkest, juiciest parts of the Bible.
![Interactive Infographic: Trends in Higher Education [Good; U of Phoenix]](http://danielschristian.com/learning-ecosystems/wp-content/uploads/2011/09/InteractiveData-UofPandGOOD2-9-2011.jpg "InteractiveData-UofPandGOOD2-9-2011")

From DSC:
Immediately below is a presentation that I did for the Title II Conference at Calvin College back on August 11, 2011
It is aimed at K-12 audiences.
From DSC:
Immediately below is a presentation that I did today for the Calvin College Fall 2011 Conference.
It is aimed at higher education audiences.

Note from DSC:
There is a great deal of overlap here, as many of the same technologies are (or will be) hitting the K-12 and higher ed spaces at the same time. However, there are some differences in the two presentations and what I stressed depended upon my audience.
Pending time, I may put some audio to accompany these presentations so that folks can hear a bit more about what I was trying to relay within these two presentations.

From DSC:
I want to post a thank you note to Mr. Steven P. Jobs, whom you most likely have heard has resigned as Apple’s CEO. Some articles are listed below, but I want to say thank you to Steve and to the employees of Apple who worked at Apple while he was CEO:
Thanks again all!
A visualization of the United States Debt — from usdebt.kleptocracy.us
From DSC:
Though this is the U.S. debt, the ramifications of this affect the entire globe. I believe my cousin, Mr. Stephen Gibson, is correct when he says that we may well be heading towards a “Global Reset.”


Also see:

— as of 8/24/11 around noon
Addendums later on 8/24/11 from Academic Impressions:
 MPR Photo/Jeffrey Thompson
Just what are states pledging for higher ed these days?
The study features the College Savings Indicator, a calculation of the percentage of projected college costs the typical American family is on track to cover, based on its current and expected savings. After four consecutive years of decline, the Indicator held steady to the prior year at 16 percent, down from 24 percent in 2007, when Fidelity first launched the study. While overall preparedness has declined, a larger percentage of parents — more than two-thirds (67 percent) — have begun saving for college costs, compared with 58 percent five years ago.

7 essential books on data visualization & computational art — from brainpickings.org by Maria Popova
Data Visualization: Journalism’s Voyage West — from Stanford University
This visualization plots over 140,000 newspapers published over three centuries in the United States. The data comes from the Library of Congress’ “Chronicling America” project, which maintains a regularly updated directory of newspapers.

