Trends in college pricing 2014 — from trends.collegeboard.org

Excerpt (emphasis DSC):
Trends in College Pricing provides information on changes over time in undergraduate tuition and fees, room and board, and other estimated expenses related to attending colleges and universities. The report, which includes data through 2014-15 from the College Board’s Annual Survey of Colleges, reveals the wide variation in prices charged by institutions of different types and in different parts of the country. Of particular importance is the focus on the net prices students actually pay after taking grant aid into consideration. Data on institutional revenues and expenditures and on changing enrollment patterns over time supplement the data on prices to provide a clearer picture of the circumstances of students and the institutions in which they study.
…
Between 2013-14 and 2014-15, average published tuition and fee prices increased by 2.9% for in-state students in the public four-year sector, by 3.3% for out-of-state students in the public four-year sector and for in-district students at public two-year colleges, and by 3.7% at private nonprofit four-year institutions. These increases are higher than the 2.0% increase in the Consumer Price Index between July 2013 and July 2014, but in all sectors these price increases are lower than the average annual increases in the past five years, the past 10 years, and the past 30 years.
…
College Affordability
Average income was lower in inflation-adjusted dollars in 2013 than it had been in 2003 for all but the highest-income families.
– The $70,821 increase (in 2013 dollars) in the average income of the top 20% of families between 1983 and 2013 compares to an increase of $8,936 for the middle quintile and to an increase of $578 for the lowest quintile of families.
– Average published tuition and fees for in-state students attending public four-year colleges rose by $6,324 (in 2014 dollars) between 1983 and 2013 — 71% of the increase in income ($8,936) of the middle 20% of families and 9% of the increase in income ($70,821) of the 20% of families in the highest-income bracket.
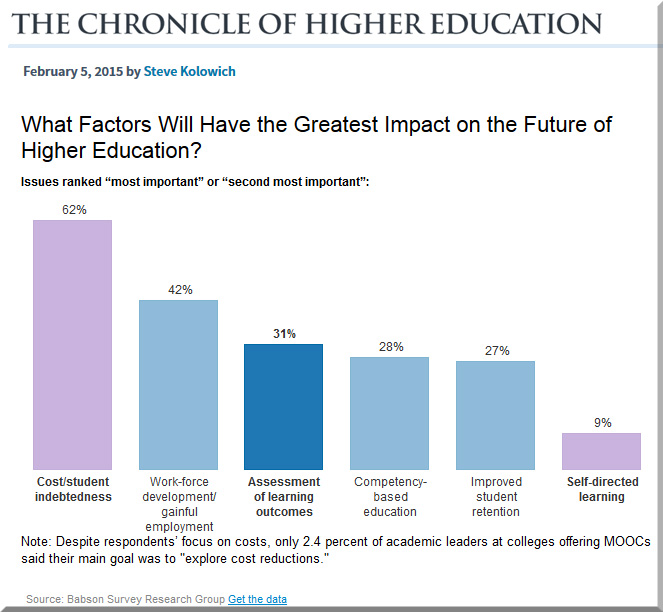
A related, excerpted graphic from The MOOC Hype Fades, in 3 Charts
But first, a side note/comment from DSC:
It’s waaaayyy to early to say that MOOCs are all washed up, dead, or won’t be influencing the future of higher education any more (or the corporate world for that matter). We’re but at the embryonic stages of understanding and using big data, learning-based analytics, competency-based education, and network-based effects w/in education (and training). Who knows what we call MOOCs these days will morph into? Also, there’s a whole lot more to online learning than MOOCs.
Also, it’s a bit disturbing that the factor of self-directed learning rates last in the graphic below; because that’s what EVERYONE needs to have and be able to do these days.
BTW, I’m not saying that the author is suggesting MOOCs are dead, but others within higher education seem to be saying that. Again, MOOCs are not done morphing yet.